How can understanding different generations help drive business decisions and brand development? Many years ago, I was given the assignment to develop an infographic interpreting trends outlined in a Pew Research article published in 2014, discussing the differences in motivations between generations in the then-current workforce. Although outdated for current implications, it remains that executives and workforce leaders understand the styles and motivations driving the different generations in the workforce. Today’s workers span from Alpha to Boomer, with the differences even wider than this 2014 article described. The graphic here largely discusses the differences between Millenials and Gen X/Boomers. If I were to re-do this today, I’d need at least three axes, since the generation undernePew Research article published in 2014ath Millenials have brought an even wider range of talents, motivations, and influences than were present before they entered the workforce, and thus those having disposable income.
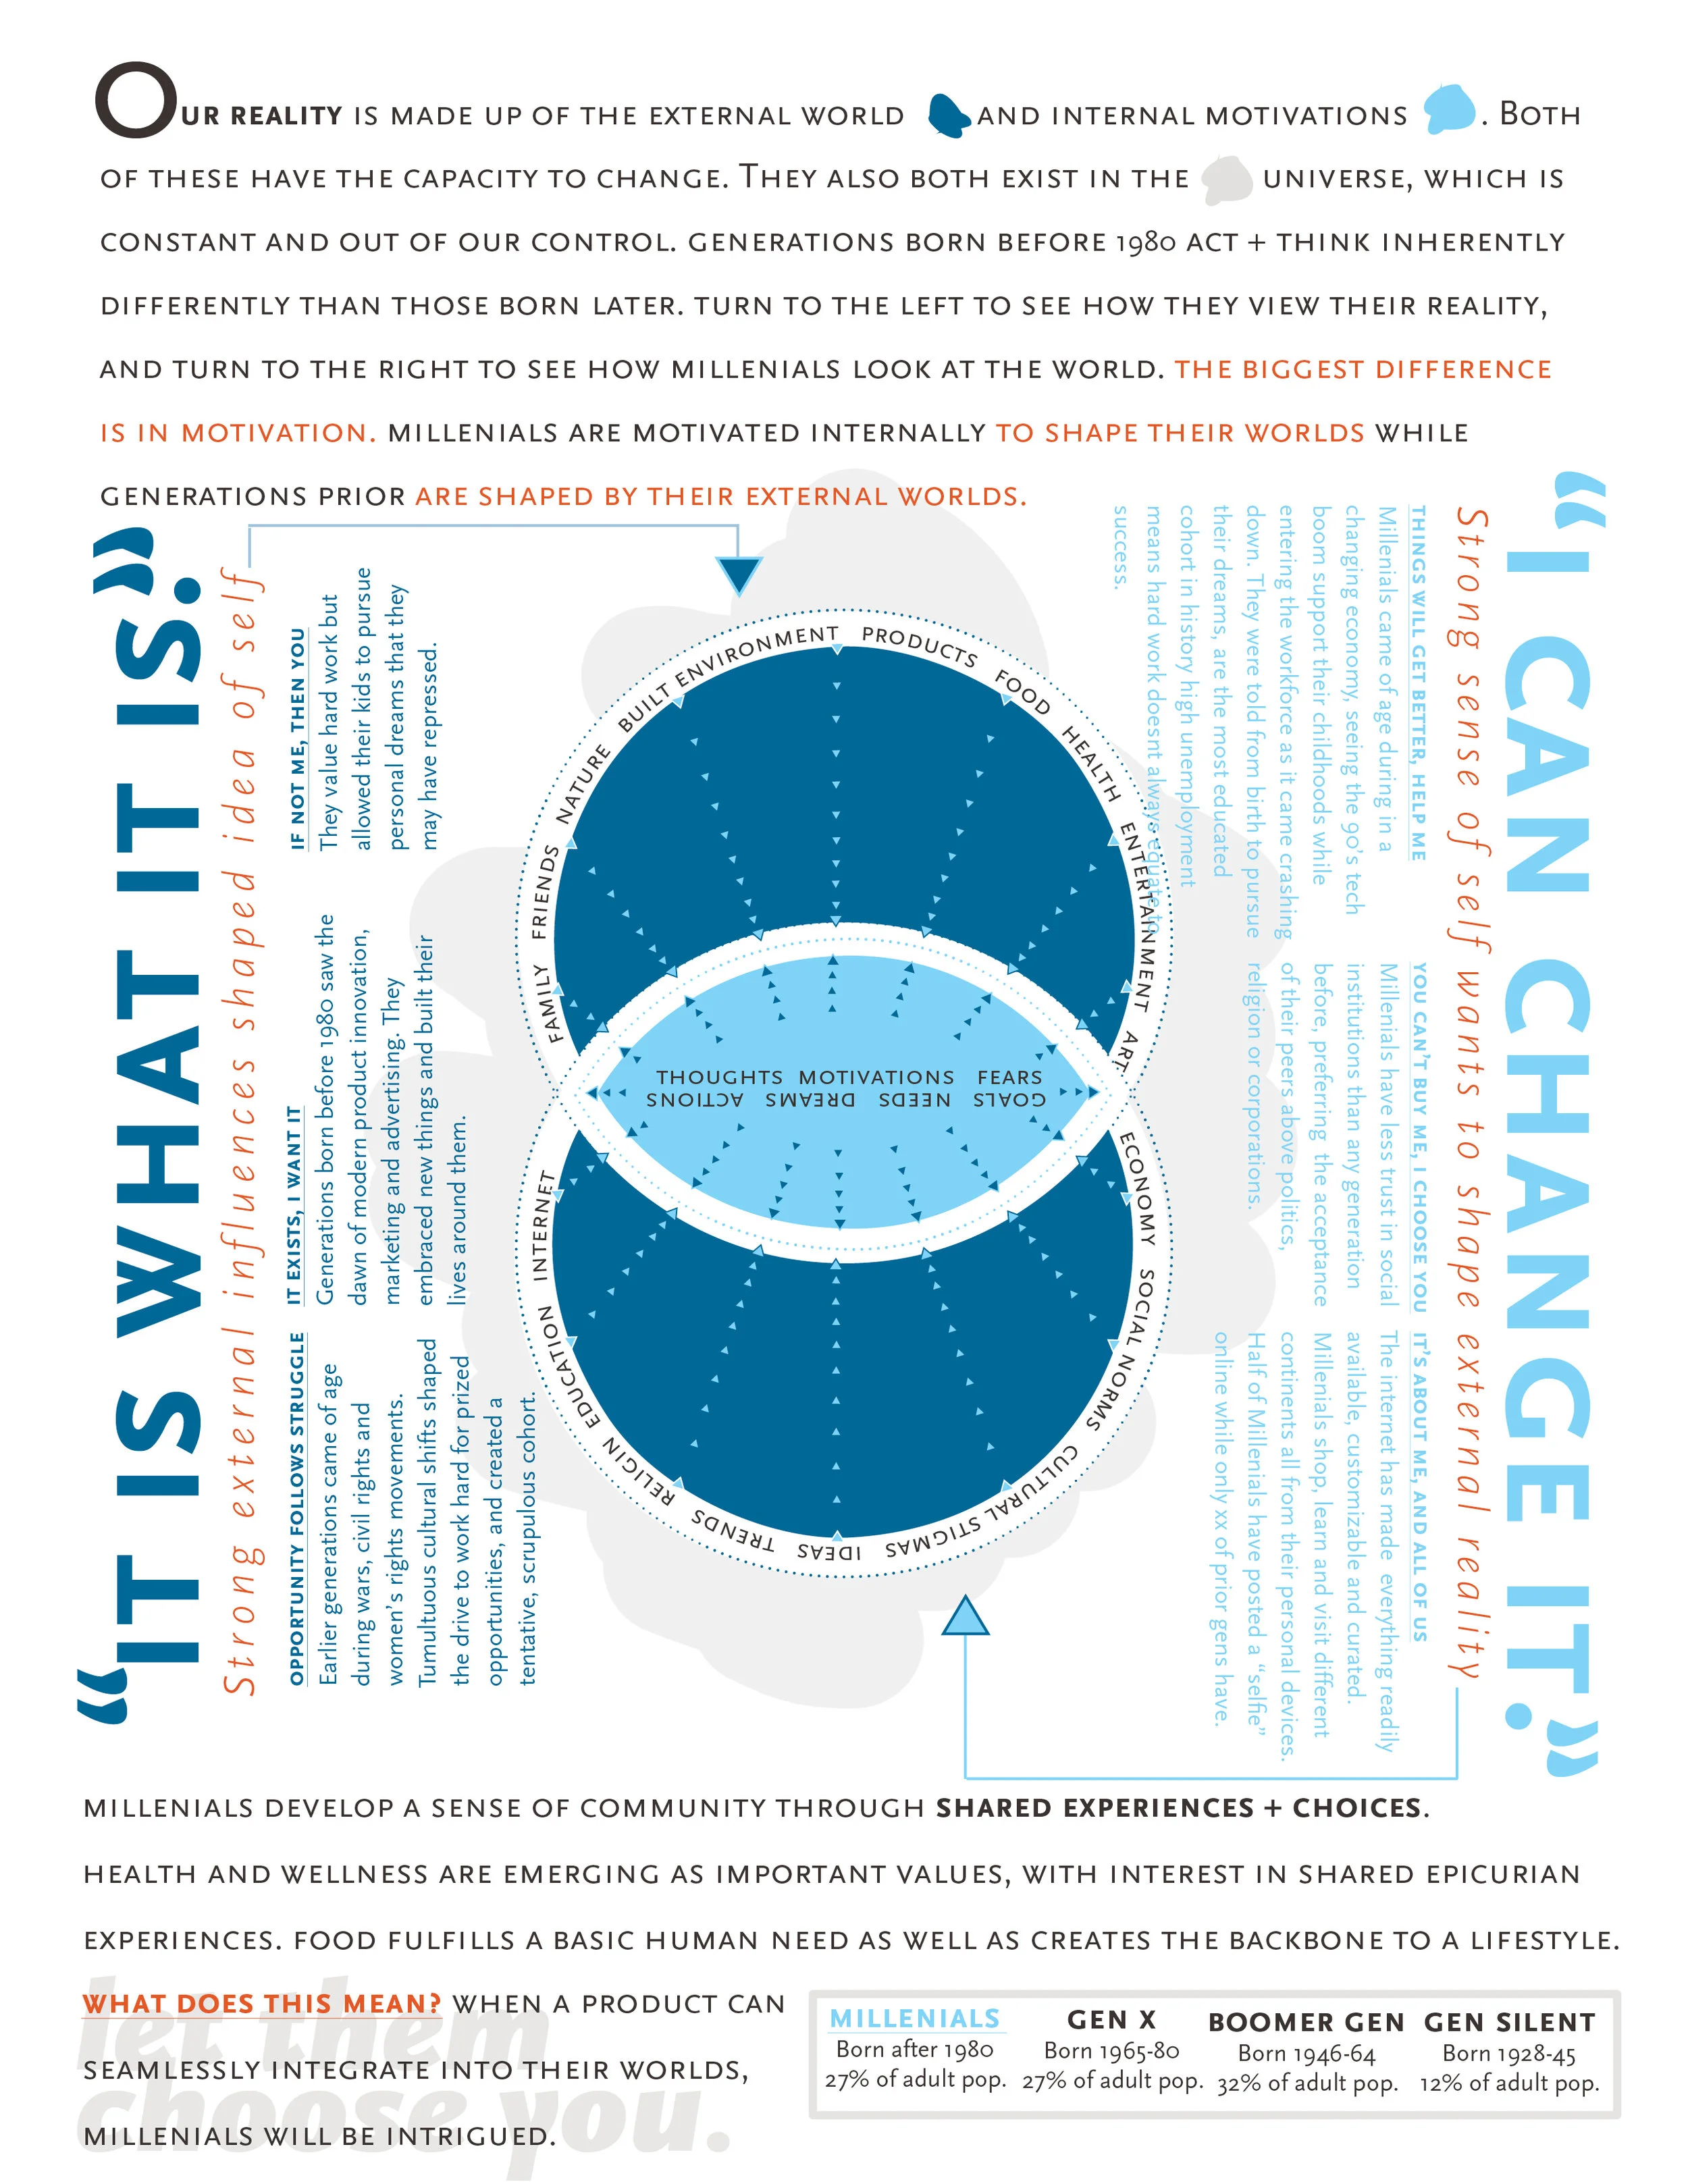
The dark blue portions of the infographic below represent the Generations born before 1980. They are, when compared to later generations, more motivated by external forces. Things like their family and friends, their built environments, the activities they take part in, the economy and social norms. These forces "push in" and drive their behaviors. It’s not that they accept whatever comes their way, but they have a reverence for the way things are, and adjust accordingly. Generations born after 1980, in light blue, are driven by internal desires, motivations and see their external world as something that is to be shaped, instead of being shaped by it. Their actions "push out" on these external forces, molding the world into their ideal visions.
What can understanding these differences do for the workforce? What happens when team members are motivated in completely opposite ways? How can these insights generate return over time for your brand? Working with and selling to Millenials, the answer seems to be, speak to their sense of self, appeal to what they value, let them choose you. For older generations, deliver a sense of purpose, a reason to show up: choose them, need them.
The graphic below isn’t a typical ‘infographic’ and wouldn’t appear in a report or academic publication. I wanted to create a designer’s interpretation of the facts presented in the article. Something that invites thought, consideration, something that could be hung over an office desk to invite further inspection. That said, viewing this almost a decade later and some glaring typographic inconsisentcies are jumping out to me. In the last decade I’ve honed both my research skills and my typography taste, I guess. I still enjoy looking at this, as a different way of looking at data - circular, balanced, and as a visual story.